http://business.financialpost.com/2014/09/22/judith-curry-an-unsettled-climate-for-climate-summit/
From one of my favourite climatologists who, a decade ago, was touting the hurricane/climate change link as co-author of a couple papers on the issue. However throughout the past decade, through discussions on her blog, her position has moderated drastically, acknowledging that models are not matching real data and there is far too much uncertainty to make economic policies that would be detrimental.
Here is an article profiling JC.
Showing posts with label Global Warming. Show all posts
Showing posts with label Global Warming. Show all posts
Wednesday, September 24, 2014
Monday, May 12, 2014
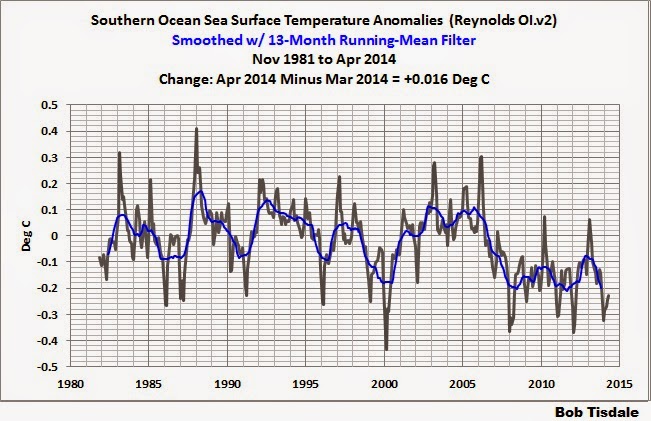
Climate Alarmism du jour...
You may have noticed recent news articles about collapsing Antarctic icesheets. Here I present some graphs and a map as counterpoint. Please tell me how decreasing sea temperatures (first graph), steadily increasing sea ice levels (second graph and map) and stable air temperatures can co-exist with an apparent melting glacier??? Things that make you go hmmmmm.


Wednesday, April 23, 2014
They can't win for losing...
They being those who try to connect extreme weather, and in this particular case, tornadoes to Climate Change, Global Warming, Climate Disruption....

Friday, May 4, 2012
May "meh" season
Tis the season of "meh", the season in which nothing much happens weather-wise, placid May. The time for major snowstorms is generally done for major population areas and tropical storm season gets revved up next season.
So to pass the time, I thought I'd pass along a website where you can see all kinds of climatic data in a graphical format. I will add the link to my sidebar. Peruse through atmospheric, ocean, solar, etc. data from various data sets with comparisons between. You can see for yourself that by looking at actual data as opposed to computer models, the sceptical side for the climate change debate have plenty of reasons to be sceptical.
So to pass the time, I thought I'd pass along a website where you can see all kinds of climatic data in a graphical format. I will add the link to my sidebar. Peruse through atmospheric, ocean, solar, etc. data from various data sets with comparisons between. You can see for yourself that by looking at actual data as opposed to computer models, the sceptical side for the climate change debate have plenty of reasons to be sceptical.
Thursday, May 3, 2012
Polar Bears, Part III
Rumours of drowning polar bears are greatly exaggerated. This flies in the face of CAGW propaganda like Al Gore's "The Inconvenient Truth" and documentaries like "Planet Earth" which depicts a bear swimming and swimming until he reaches shore but is too weak to hunt some elephant seals and dies. I nearly threw out my copy of Planet Earth when I saw that BS.
Previous Polar Bear posts here and here.
Previous Polar Bear posts here and here.
Thursday, April 5, 2012
Monday, April 2, 2012
The March Heatwave
NOAA has released their preliminary analysis of the March Heat Wave. They call the event a Black Swan event, that is an event that has an extremely low probability, a very high impact, and only retrospective predictability, ie limited, if any, prospective predictability. Unfortunately, imho, they conclude with a nod to AGW with an ambiguous statement that they estimate that the magnitude of the heat wave was increased 5 to 10% by GHG effects. I've seen similar estimates for the 2011 Texas drought but there is no way to prove or measure that effect. So these estimates is purely based on model outputs, not on observations.
Thursday, March 29, 2012
Friday, March 23, 2012
Land cover/use change

At this time, I will remind readers that the only reasons CO2 is being blamed for AGW is that
- it is known to be a "greenhouse" gas,
- it has been increasing in the atmosphere, especially in the last 100 years and
- there has been a global temperature (GMST) increase of less than two degrees in that time period as well.
So there is a moderate (not a strong) co-relation between atmospheric CO2 levels and GMST, plus the "greenhouse" theory plus model outputs and there's your Global Warming scaremongering about the CO2 strawman.
Many alarmist climate "scientists" think CO2 is the single most important forcing that's causes global warming/climate change/climate disruption/whatever have you. But there is growing contingent of science that think that Land cover/use change has as large or larger impact on the climate as CO2 (RPS has been banging this drum forever with little impact). It has effects on albedo, wind patterns, boundry layers, carbon sink/source values, etc. and etc. Definitely not an insignificant role.
Monday, March 19, 2012
Everybody on the bandwagon!
It's a good time to be a weather enthusiast because everybody is talking about the weather. And there is plenty to talk about... Well actually, only one thing right now in our neck of the woods and that is the balmy temperatures (we won't mention the snowstorm in Arizona). We are having May and June like temperatures. Records are being blasted and beaten like a rented mule, left, right and center. And these positive temp anomalies will continue for a while, albeit reduced somewhat by the end of the month in certain areas.
Naturally, the question comes: is this Global Warming? Some would predictably say yes... I would say no, again predictably. Climate/weather always changes and unique circumstances can always occur. If you remember back in my December 22nd post, I commented how we were in a relatively unique atmospheric weather situation. That continued throughout the winter. Alaska had its coldest January on record. Eastern Europe had record cold and snows in February as did Northern China. But we had warm temperatures and a lack of snowstorms, especially in the eastern half of the N. American Continent. As a result we have a lack of snowcover (4th lowest N.America winter on record) and record high Great Lake temperatures. So any strong southerly flow of air will be un-moderated, un-cooled and ripe for breaking records. And that is what is happening big time.
So both the current AND preceding weather patterns are responsible for our current weather. Enjoy it. It may lead to a cooler than normal summer.
Update Mar.22nd: I've added a couple links to show my points about a global view of weather.
Wednesday, January 25, 2012
Global Temp snapshot
Lest any of you think our recent warm temperatures are a global phenomenon (click to embiggen):


Friday, January 20, 2012
Tuesday, January 17, 2012
Glaciers in the news
Glaciers have been in the news again (with crossposts to various social media groups) with the release of a time lapse video of the Columbia Glacier in Alaska with the inevitable alarm with what Global Warming is doing to the glaciers.
Total BS, pardon my french, on two fronts.
First is the full recorded history of the glacier, which with photographic evidence has retreated for hundreds of years, far before the onset of so-called AGW. WUWT has good smack down of this here.
Second is the temperature record of the area. For this purpose I have selected Anchorage as the representative station from NASA's GISTEMP dataset, hardly a skeptic organization. I also selected the primary melt season: June thru August. Below is the graph of the summer temperatures at Anchorage. There is no trend.
Then there's the glaciers in the Washington/Oregon regions of the US. Read this and this for details.

Monday, December 12, 2011
The result of Durban
Long and short, the agreement they came to was...to agree to talk again and try to come to an agreement by 2015 that comes into effect in 2020 that will have less stringent requirements that Kyoto had.
All I know is, if Greenpeace is unhappy, I am happy.
As an aside, I have a hunch that 2020 date was chosen since are more than a few CAGW skeptical scientists who think we will have a 20 year plus negative trend in Global temperatures by that point, which I hope will be the case. If so, than the natural vs manmade climate change proportion will be up-ed, defying all current Global Climate Models.
Update: Interesting analysis of Durban here.
Wednesday, December 7, 2011
Permafrost
Remember when Global Warming was going to melt all the Russian permafrost, releasing tonnes of potent GHG methane into the atmosphere making Global Warming worse, melting more permafrost, etc etc? Well, nevermind.
Tuesday, November 22, 2011
Climategate 2.0
Two years ago, on the eve of the Copenhagen climate conference, unknown person(s) released thousands of documents revealing the machinations of the warmist climate scientists. It was dubbed Climategate.
The next climate conference is happening shortly in Durban and it's happened again. Anothe cache of revealing emails and other documents from the warmists have been released. Details here:
http://noconsensus.wordpress.com/2011/11/22/climategate-2-0/
http://climateaudit.org/2011/11/22/new-climategate-emails/
http://tallbloke.wordpress.com/2011/11/22/breaking-news-foia-2011-has-arrived/
http://wattsupwiththat.com/2011/11/22/climategate-2-0/
http://rankexploits.com/musings/2011/son-of-climategate/
Tuesday, November 1, 2011
Some recommended reading...
Monday, October 24, 2011
Friday, October 21, 2011
Berkeley Earth Surface Temperature
You may have seen the results of the PR campaign from a group from Berkeley who has analyzed and compiled land surface temperatures (no SST info yet) into a new data set with improved statistical methods than the current major indicies, NOAA, GISS, HADCRUT. Some highlights:
Causal issues are not addressed, at least skirted in the decadal cycles portion. The study authors emphasize that causes for the measured land warming is not the issue dealt with in these studies. Some blog entries on this with the first couple from co-authors of the studies.
http://online.wsj.com/article/SB10001424052970204422404576594872796327348.html#printMode
http://judithcurry.com/2011/10/20/berkeley-surface-temperatures-released/
http://dotearth.blogs.nytimes.com/2011/10/20/skeptic-talking-point-melts-away-as-an-inconvenient-physicist-confirms-warming/
http://wattsupwiththat.com/category/berkeley-earth-surface-temperature/
http://www.bishop-hill.net/blog/2011/10/21/keenans-response-to-the-best-paper.html
http://calderup.wordpress.com/2011/10/20/the-long-pause-in-warming-confirmed/
http://pielkeclimatesci.wordpress.com/2011/10/20/comment-on-the-article-in-the-economist-on-rich-mullers-data-analysis/
http://wmbriggs.com/blog/?p=4525
I will provide updates when required.
Update1: Back in the day when I had time, I played with some numbers and came to a similar conclusion as the Berkeley group regarding the decadal oceanic cycles.
- Close agreement with other major datasets
- UHI has minimal effect on final value of GMST, but local effects remain
- There are surface station quality issues but 30% of land surface stations show long term cooling trends
- There are significant co-relations with oceanic decadal cycles
Causal issues are not addressed, at least skirted in the decadal cycles portion. The study authors emphasize that causes for the measured land warming is not the issue dealt with in these studies. Some blog entries on this with the first couple from co-authors of the studies.
http://online.wsj.com/article/SB10001424052970204422404576594872796327348.html#printMode
http://judithcurry.com/2011/10/20/berkeley-surface-temperatures-released/
http://dotearth.blogs.nytimes.com/2011/10/20/skeptic-talking-point-melts-away-as-an-inconvenient-physicist-confirms-warming/
http://wattsupwiththat.com/category/berkeley-earth-surface-temperature/
http://www.bishop-hill.net/blog/2011/10/21/keenans-response-to-the-best-paper.html
http://calderup.wordpress.com/2011/10/20/the-long-pause-in-warming-confirmed/
http://pielkeclimatesci.wordpress.com/2011/10/20/comment-on-the-article-in-the-economist-on-rich-mullers-data-analysis/
http://wmbriggs.com/blog/?p=4525
I will provide updates when required.
Update1: Back in the day when I had time, I played with some numbers and came to a similar conclusion as the Berkeley group regarding the decadal oceanic cycles.
Tuesday, September 20, 2011
"Missing Heat"
I just had to laugh. You may have seen news articles proclaiming a new study that the "missing heat" may have been found in the deeeeeep ocean where there are very few measurements.
This study comes from Kevin Trenbeth, a man whose name was all over the Climategate files, blocking papers, forcing journal editors to resign, redefining peer-review and all kinds of other mischief. But perhaps his most famous quote of Climategate was "The fact is that we can't account for the lack of warming at the moment and it is a travesty that we can't."
The lack of warming is the fact that global atmospheric temperatures have been flat for the last 10 years. The upper ocean heat content (0 - 700m) has been flat since 2003. So the warmists have this theory that all this CO2 in the air has to force atmospheric and oceanic temperatures up and up and up and natural cycles be damned. However, those darned observations are not agreeing with theory so the observations are inadequate. Another Climategate Trenbeth quote: "but the data are surely wrong. Our observing system is inadequate."
So to reconcile the difference between theory and observations, the heat must be where we can't observe it, in the deep ocean. That is discounting the reality that there is no physical mechanism where the upper ocean heat content can remain flat while the deep ocean increases in heat content for that length of time. It's physically impossible. But that doesn't necessarily stop the warmists from outputting garbage from a computer model. Pielke Sr. has a discussion here.
Subscribe to:
Posts (Atom)