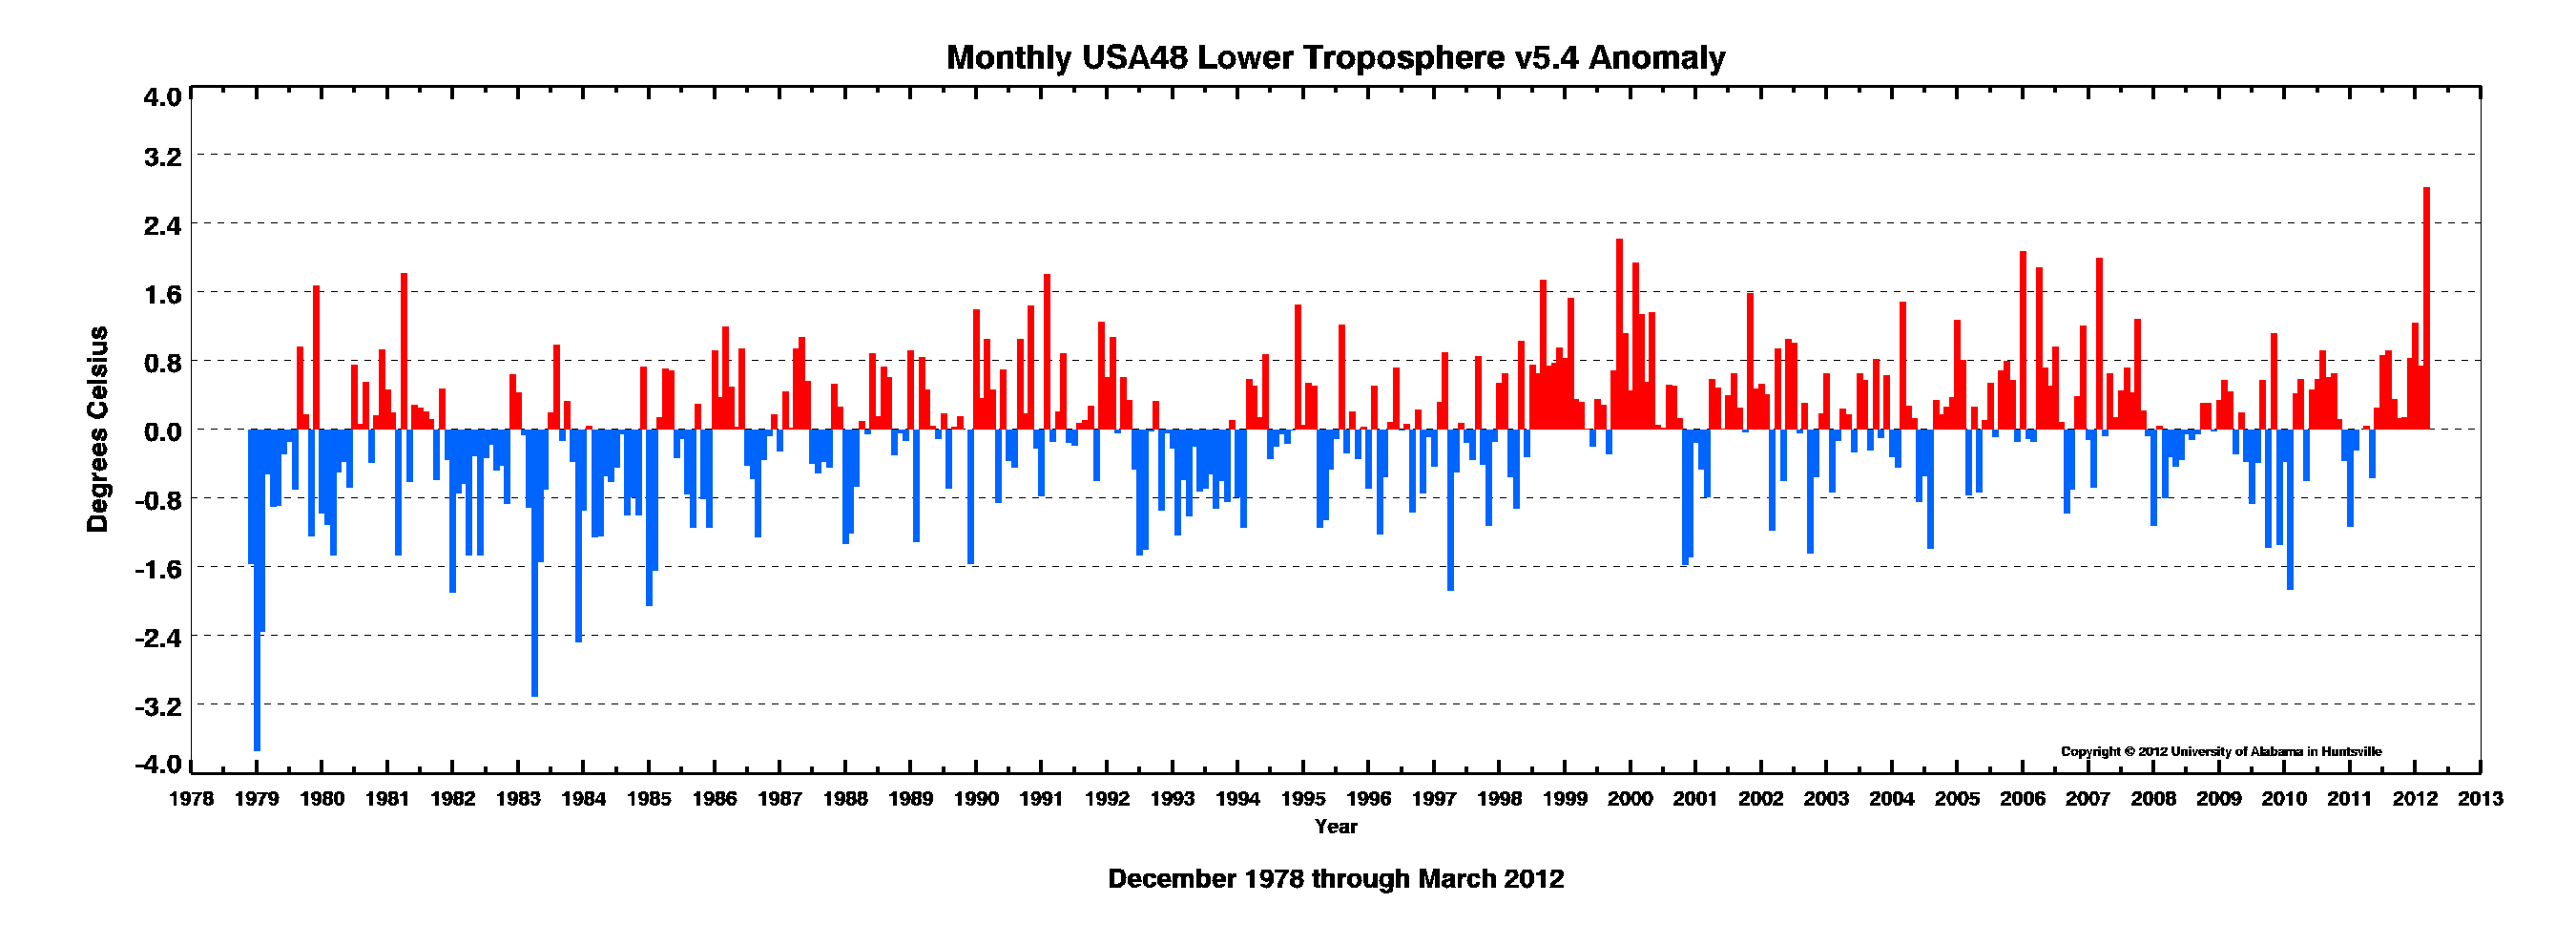
I have several maps and graphs to show here. The first is the temperature anomoly map of the US for the month of March. After that is a graph of the US monthly temperature anomoly graph. While noting the uniqueness of March, note as well the complete lack of pos/neg trend or increase of extremes. The next map is an overlay of the State of Alaska of the US to show some size perspective. Some notes about Alaska's winter:
- Coldest January on record
- 10th coldest March on record
- Anchorage, Alaska (among other places) had a record amount of snow.


No comments:
Post a Comment